


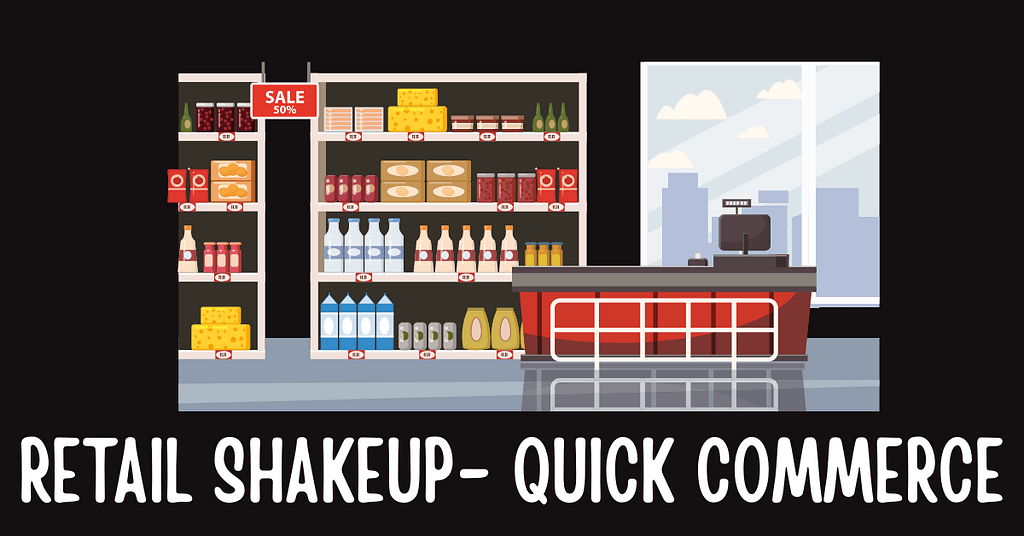
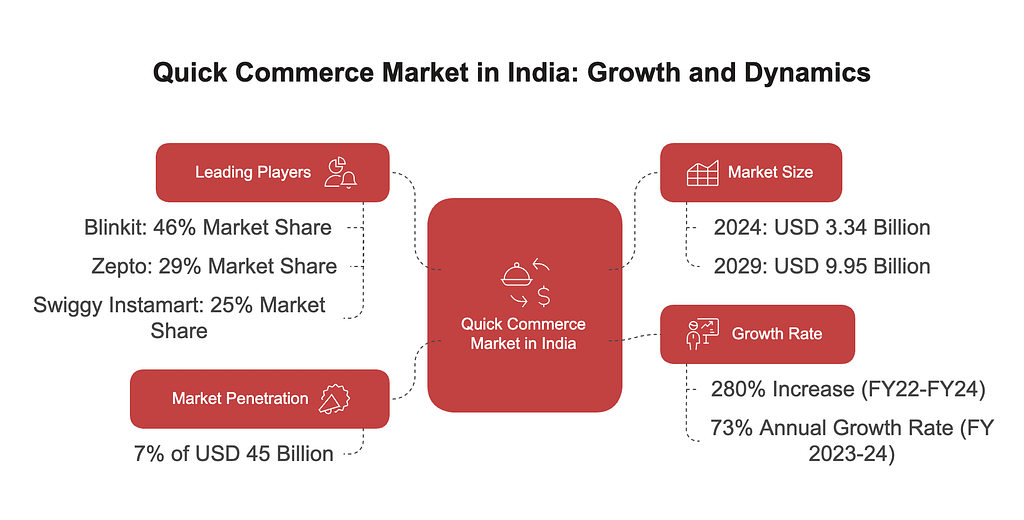
India’s retail landscape is undergoing a major transformation. Quick commerce India is emerging as a powerful force, offering a $9.95 billion opportunity by 2029. While traditional e-commerce grows at 14% annually, quick commerce is booming at a 73% CAGR.
This model uses over 2,000 dark stores and AI-powered logistics to deliver orders in 8–11 minutes. However, challenges remain in unit economics and sustainability. The sector now commands a 7% penetration of a $45B addressable market, with Blinkit (45% share) and Zepto (valued at $3.6B) leading the change and reducing reliance on kirana stores by 46%.
India’s $1.2 trillion retail market is split into two parts:
- Traditional Retail:
12 million kirana stores contribute 80% of FMCG sales but see a 4–6% annual decline in urban footfall. - Quick Commerce (Q-Commerce):
A $3.34B market in 2024 that adds 5M monthly users through 10-minute delivery promises.
This disruption mirrors China’s 2015 New Retail revolution but features uniquely Indian characteristics, including hybrid models that integrate kiranas, hyperlocal dark stores, and fintech-enabled payments.
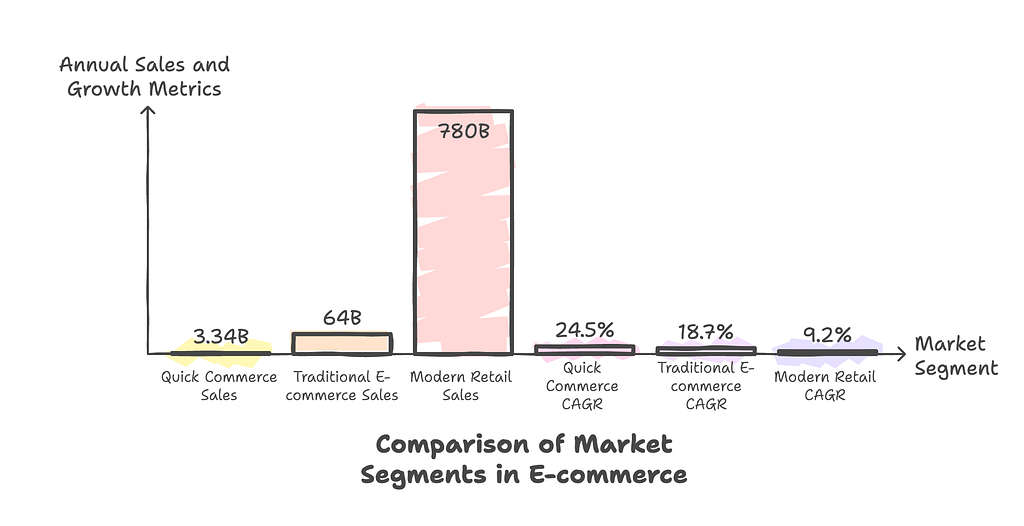
Market Landscape & Trends
| Metric | Quick Commerce | Traditional E-commerce | Modern Retail |
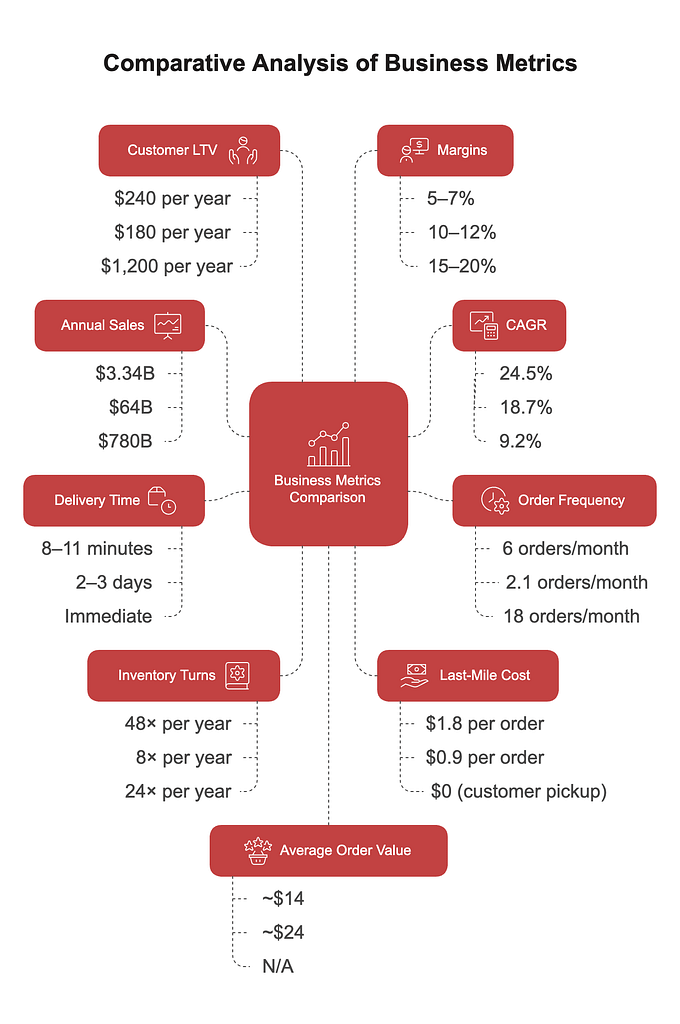
| Annual Sales (2024) | $3.34B | $64B | $780B |
| CAGR (2024-2029) | 24.5% | 18.7% | 9.2% |
| Order Frequency | 6/month | 2.1/month | 18/mont |
| Delivery Time | 8-11 mins | 2-3 days | Immediate |
Sales, Growth, and Order Metrics
Annual Sales (2024)
- Quick Commerce: $3.34B
- Traditional E-commerce: $64B
- Modern Retail: $780B
CAGR (2024-2029)
- Quick Commerce: 24.5%
- Traditional E-commerce: 18.7%
- Modern Retail: 9.2%
Order Frequency
- Quick Commerce: 6/month
- Traditional E-commerce: 2.1/month
- Modern Retail: 18/month
Delivery Time
- Quick Commerce: Immediate (8–11 minutes)
- Traditional E-commerce: 2–3 days
Growth Drivers Quick Commerce India
- Urbanization:
Urban population increases from 35.4% in 2024 to 40% by 2030, supporting dense areas for 2 km delivery radii. - Tech Adoption:
78% of orders are placed via apps, and 65% of consumers are willing to pay a premium for delivery in under 30 minutes. - Behavioral Shift:
42% of customers use quick commerce for ready-to-eat meals compared to 28% via traditional e-commerce.
Deep Dive into Quick Commerce
Operational Model
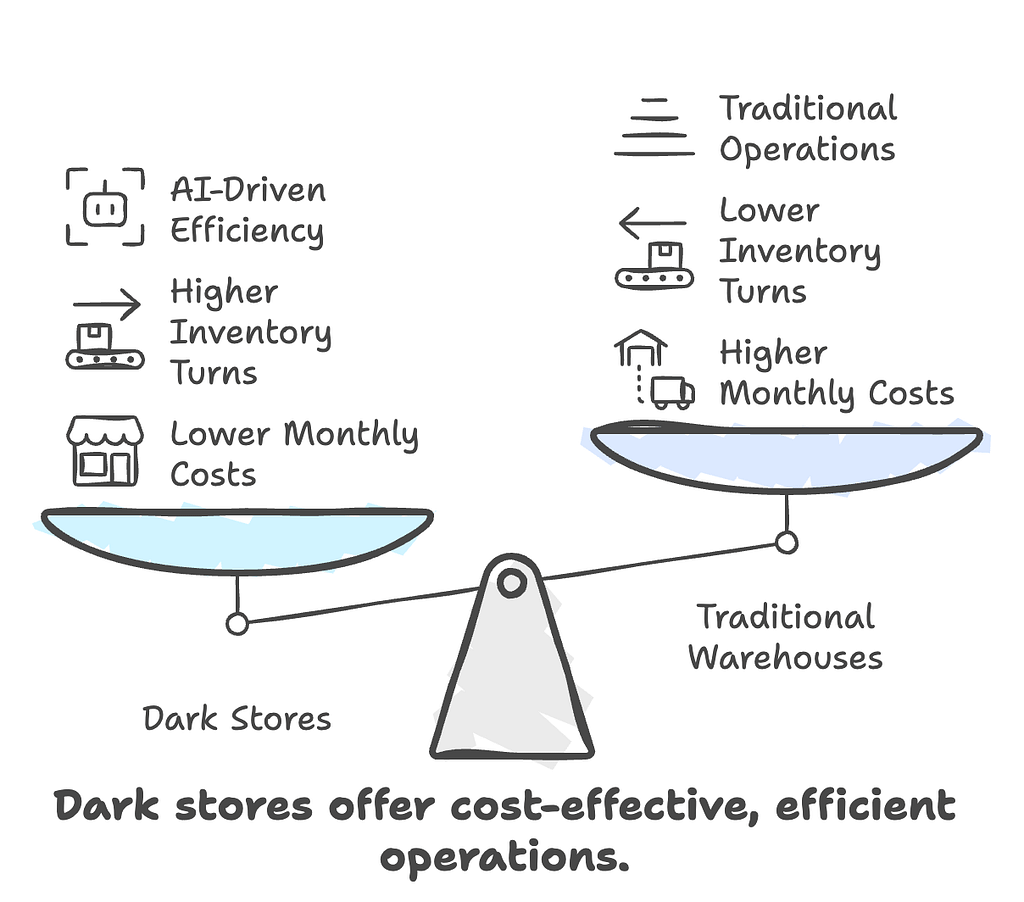
Dark Store Economics
- Cost Structure:
$12K–$18K per month per store versus $12M for a traditional warehouse. - Inventory Turns:
48 times per year, compared to 8 times for traditional e-commerce using fewer than 2,000 curated SKUs.
Tech Stack
- Swiggy’s MARTech:
Processes 500K orders per day with 98.4% SLA compliance. - Zepto’s AI:
Reduces picking time to 43 seconds.
Market Leaders Analysis
| Company | Delivery Time | Market Share | Key Strength | Valuation |
| Blinkit | 11 mins | 45% | Zomato’s ecosystem synergy | $13.4B (Zomato) |
| Zepto | 9 mins | 21% | Dark store automation | $3.6B |
| Swiggy Instamart | 8 mins | 27% | Instamart Cloud kitchens | $12.7B (Swiggy) |
- Blinkit’s Profitability Hack:
- 62% of orders come from a radius of less than 3 km.
- 89% repeat customers in the top 8 cities.
Comparative Analysis
| Aspect | Quick Commerce | E-commerce | Modern Retail |
| Inventory Turns | 48x/year | 8x/year | 24x/year |
| Last-Mile Cost | $1.8/order | $0.9/order | $0 (customer pickup) |
| Customer LTV | $240/year | $180/year | $1,200/year |
| Margins | 5–7% | 10–12% | 15–20% |
Quick commerce achieves 3.2 times higher basket replenishment frequency than e-commerce but has a 43% lower average order value ($14 vs. $24).
Impact on Traditional Retail
Negative Impacts on Kiranas
- Footfall Erosion:
- 46% of quick commerce buyers have reduced their purchases at kirana stores, with 82% shifting at least 25% of spending to digital platforms.
- Metro areas see a 4–6% annual decline in footfall, leading to about 200,000 kirana closures since 2022.
- Pricing Pressure:
Bulk discounts and cashbacks in quick commerce lower kirana margins, as 68% of consumers prefer app-based deals. - Inventory Challenges:
Dark stores achieve 48 inventory turns per year versus 12 for kiranas, limiting traditional retailers’ ability to match product freshness and variety.
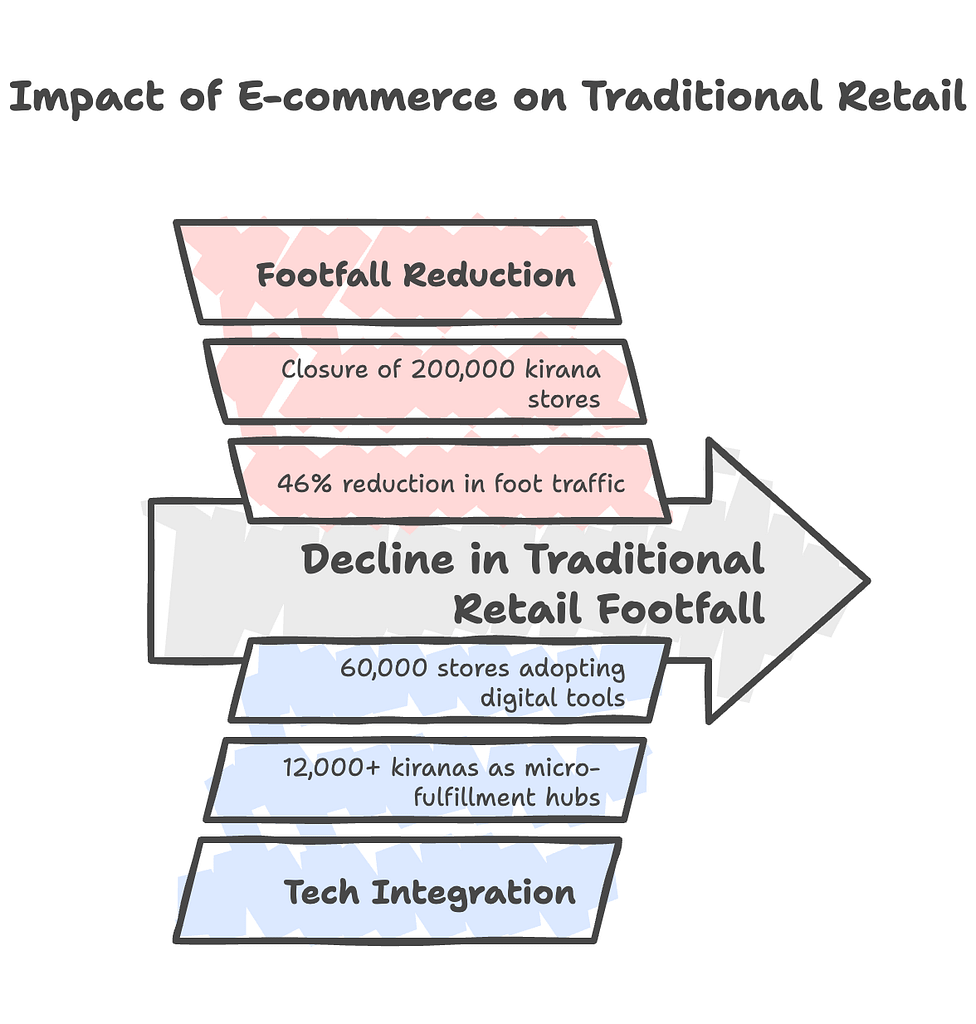
Adaptive Responses from Traditional Retail
Tech Integration
- Hybrid Models:
Over 12,000 kiranas now serve as micro-fulfillment hubs for Blinkit and Zepto, earning an additional 18–22% revenue. - Digital Tools:
Udaan equips 60,000 stores with inventory management tablets, reducing stockouts by 37%.
Operational Upgrades
- Speed Matching:
41% of urban kiranas now deliver in under 30 minutes using bike fleets, up from 8% in 2022. - Personalization:
AI-powered apps like JioMart Partner allow kiranas to offer tailored discounts, boosting customer retention by 29%.
Ecosystem Partnerships
- Inventory Sharing:
For example, BigBasket’s BB Now integrates 8,000 kiranas, reducing wastage by 22%. - Last-Mile Collaboration:
Programs like Dunzo’s Kirana Delivery cut delivery costs by 40%.
Strategic Implications
- Urban vs. Rural Divide:
- In metros, 58% of kiranas report profit declines of more than 15% YoY.
- In Tier 2/3 cities, 73% of store owners using WhatsApp commerce report 12–18% revenue growth.
- Future Projections:
- Quick commerce is set to capture 15% of the $250B urban grocery market by 2027, while kiranas’ market share drops from 92% to 84%.
- Employment shifts with 850K gig jobs created in quick commerce versus 2.1M traditional retail jobs at risk.
Quick commerce is pushing traditional kiranas to adapt. Some become tech-enabled innovators, while others face significant challenges.
Consumer Behaviors: Quick Commerce vs. Traditional E-commerce
Key Behavioral Differences
| Aspect | Quick Commerce | Traditional E-commerce |
| Order Frequency | 6-8 purchases/month | 1-2 purchases/month |
| Basket Size | $8-$15 average order Value | $24-$32 average order value |
| Delivery Expectation | 83% expect ≤30-minute delivery | 67% accept 2-3 day delivery |
| Purchase Planning | 62% impulse buys for immediate needs | 89% planned purchases |
| Product Focus | 78% buy perishables/groceries | 54% purchase electronics/apparel |
Order Frequency
- Quick Commerce: 6–8 purchases per month.
- Traditional E-commerce: 1–2 purchases per month.
Basket Size
- Quick Commerce: $8–$15 average order value.
- Traditional E-commerce: $24–$32 average order value.
Delivery Expectations
- Quick Commerce: 83% expect delivery within 30 minutes.
- Traditional E-commerce: 67% accept a 2–3 day delivery timeframe.
Purchase Planning
- Quick Commerce: 62% are impulse buys.
- Traditional E-commerce: 89% are planned purchases.
Product Focus
- Quick Commerce: 78% purchase perishables and groceries.
- Traditional E-commerce: 54% buy electronics and apparel.
Drivers and Psychological Impacts
Immediacy Over Loyalty:
- 41% of q-commerce users choose the fastest available option regardless of brand
- Traditional e-commerce sees 68% repeat purchases from same platforms
Urbanization Dynamics:
- Metro consumers make 73% of q-commerce orders between 7-11 PM
- Tier 2/3 cities show 138% YoY growth in q-commerce, vs 22% in traditional e-commerce
Tech Influence:
- 55% q-commerce users select products through voice/search shortcuts vs 29% in traditional
- AR/VR product views drive 38% traditional e-commerce purchases vs 8% in q-commerce
Psychological Impacts
Quick Commerce:
- Decision Speed: 73% complete purchases in <90 seconds
- Impulse Triggers: Limited-time offers drive 59% unplanned buys
- Satisfaction: 88% rate delivery speed as primary satisfaction metric
Traditional E-commerce:
- Research Depth: 71% compare ≥3 platforms before purchasing
- Loyalty Drivers: Rewards programs influence 64% repeat buys
Emerging Paradoxes
- Convenience vs Sustainability:
- 61% q-commerce users concerned about packaging waste vs 39% traditional shoppers
- Hybrid Shopping:
- 44% use q-commerce for emergencies + traditional for bulk buys
Regional Variations
| City Type | Q-Commerce Penetration | Traditional E-commerce Penetration |
| Metro | 41% households | 68% households |
| Tier 2 | 23% | 51% |
| Rural | 7% | 29% |
This behavioral bifurcation creates parallel markets – quick commerce dominates new economy needs, while traditional platforms retain authority for considered purchases. The divide is narrowing as 32% of traditional players now offer <4-hour delivery options.
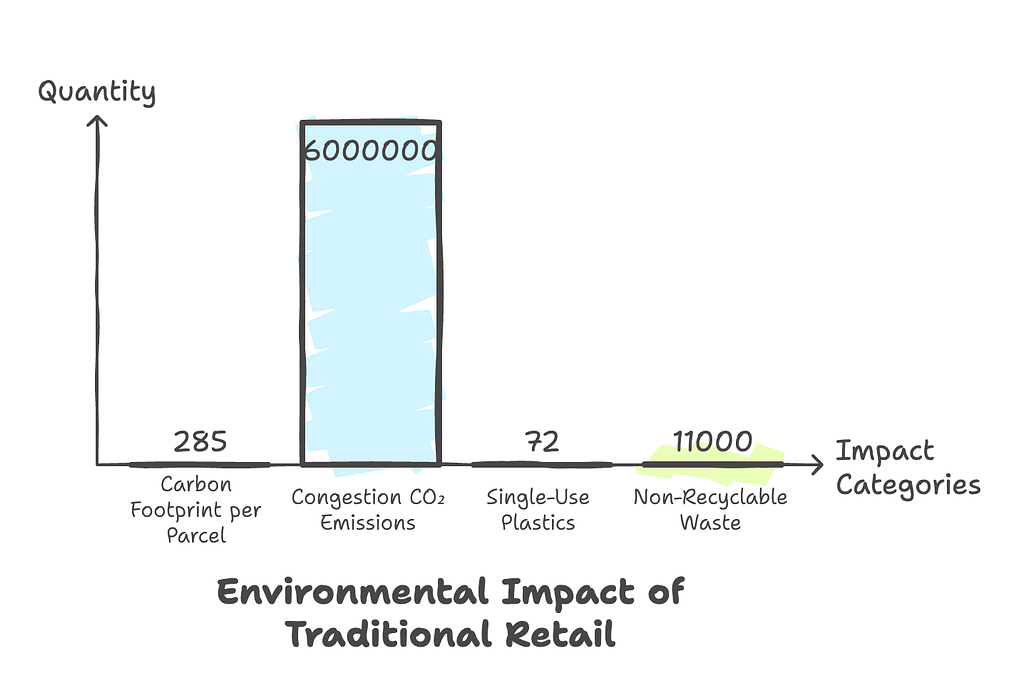
Environmental Impacts of Quick Commerce
Carbon Footprint
- Delivery Emissions:
Each quick commerce parcel generates 285g of CO₂, with transport responsible for 51% of emissions. Fast deliveries contribute to 6 million tonnes of additional CO₂ from traffic congestion. - Vehicle Impact:
Over 850,000 gig delivery riders travel 35–40 km daily in metros, using 150–200 million liters of fuel monthly. - Comparative Impact:
Traditional shopping has twice the carbon footprint of standard e-commerce, but quick commerce’s rapid deliveries reverse that advantage.
Packaging Waste
- Plastic Use:
72% of quick commerce orders use single-use plastics, creating over 11,000 tonnes of non-recyclable waste monthly. - Waste Generation:
Small basket sizes lead to more packaging waste—a ₹200 grocery order uses 300% more packaging by weight than traditional e-commerce.
Urban Infrastructure Strain
- Traffic Congestion:
Delivery fleets add 21% to peak-hour traffic in cities like Mumbai and Bengaluru, ranking them among the most congested globally. - Last-Mile Risks:
68% of quick commerce riders break traffic rules to meet delivery deadlines, increasing the risk of accidents.
Sustainability Initiatives
- Tech Measures:
AI route optimization can cut delivery miles by 30%, though it cannot offset a 138% YoY increase in orders. - Policy Proposals:
GST rebates for sustainable packaging are under discussion, but face resistance due to potential cost hikes of 18–22%. - Consumer Attitudes:
Although 61% of users are concerned about the environment, only 29% are willing to pay a premium for green deliveries.
Partial Sustainability Initiatives
| Company | Green Measures | Impact | Limitations |
| Zepto | AI-optimized routes, 30% EV fleet | 17% emission reduction in pilot cities | Only 12% fleet electrified |
| Swiggy | “Plastic-neutral” pledges | 22% packaging reduction since 2023 | Failed to meet 2024 targets |
| Blinkit | Solar-powered dark stores | 8% energy savings per facility | Limited to 15% of warehouses |
Future Outlook
In My Recent Discussion with Industry Leader from India Mr. Mayank Singh, here is the future of Retails Looks Like in 2025 and beyond:
- Emissions could triple to 18M tonnes of CO₂ by 2026 if current growth trends continue.
- Companies like Zepto show that a 24% reduction in emissions is achievable with EVs and micro-warehouses.
- The sector may need:
- Mandatory green protocols for dark stores.
- Cross-industry plastic pooling initiatives.
- Congestion pricing for urban delivery zones.
Quick commerce is not replacing Indian retail—it is creating a $45B hybrid ecosystem. Kiranas are evolving into tech-enabled dark stores, and consumers now expect fast, “now” delivery as the standard. Balancing speed, innovation, and sustainability will be crucial as the retail landscape continues to evolve in India.
Quick Commerce Growth in India 2025-Emerging Cities, Sustainability, and Profitability